

Last week’s pending home sales slipped to 68,000 single-family contracts — an expected Easter holiday lull that marks the first sub-2024 weekly tally in six weeks.
Buyers remain mortgage rate-sensitive, of course. April’s tariff-fueled spike in U.S. Treasury yields pushed borrowing costs higher, but that’s subsiding just a bit and a typical mortgage payment is roughly 4% cheaper compared to last year. Given a little calmer market, we anticipate pending sales will resume growth with next week’s report.
On the supply side, inventory climbed again and is poised to eclipse 2020 highs. New listings also dipped with the holiday but remain on track to outpace last year. Home prices are essentially flatlined. In short, April’s holiday purchase pause looks temporary. May should resume the very modest growth trend, as the broader market continues its slow march toward normalcy amid growing supply and stable prices.
For further information and insight on the housing market, join us at AltosResearch.com.
Weekly pending home sales
Just 68,000 single-family homes went into contract last week, which included the Easter holiday. So that dip in sales was expected, of course.
Due to the late Easter holiday this year, and last year’s earlier than usual Easter, this is the first time in six weeks where the weekly pending home sales came in below 2024. Home sales have finally been trending with a little growth.
The big question is what’s next. Potential homebuyers are very sensitive to mortgage rate changes. Since the tariff announcements at the beginning of April, the bond market has been on a wild ride. There was an initial big spike in both the 10-year Treasury and the spread between the 10-year and 30-year mortgage rate, which pushed borrowing costs up.
However, in the last week mortgage rates have ticked back down as the Trump administration backs away from the most destructive parts of the tariff policy. In fact, mortgage rates are below where they were last year at this time. A typical mortgage payment is 4% cheaper now than it was if you bought at the end of April last year.
In the next week, we should see the weekly pending home sales pick up significantly. I’m looking for 78,000 single-family home sales started, which would put us back above last year’s pace. Last year, because of spiking mortgage rates at the time, the weekly home sales peaked in the first week of May.
Normally, home sales don’t reach the seasonal peak until June or July. You can see last year’s peak in the blue line here. As of now, my expectation is that May home sales will resume ahead of 2024. Then there’s the Memorial Day dip in five weeks and the next dip in holiday sales is the Fourth of July.
The takeaway for the weekly pending home sales is that the holiday dip is temporary, and we currently expect home sales in May to resume being higher than last year. Last year’s sales were very low. If we come in below that, it’d be a very bearish market indicator.
Inventory
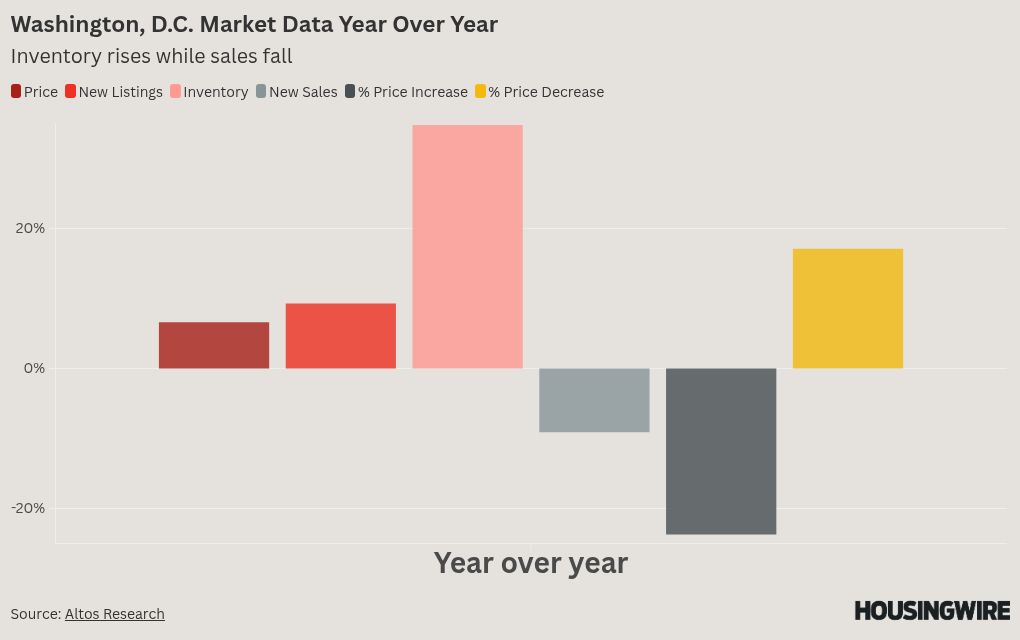
Meanwhile, on the supply side, the available inventory of unsold single-family homes grew by over 1% for the week to 729,000.
That’s 31% more homes on the market now than last year at this time. Again, because last year home sales were grinding to a halt, inventory was climbing pretty quickly. So far in 2025, inventory has been growing at a faster pace than last year. We’ll see if that changes now. This week saw a little compression to 31%, but that also includes the holiday.
In this chart, each line is a year. Next week the purple 2025 line will cross over 2020. We have more unsold homes on the market than at any time in the last seven years. The green line here is 2018. Mortgage rates were climbing in 2018, so inventory rose during that year as well.
The inventory growth curve is pretty clear. If we stay on the same trajectory without a dramatic shift in demand improving this year, then we should expect to finish 2025 with more homes on the market than at any time since before the pandemic.
New listings
There were 70,000 new listings for single-family homes this week — 10% fewer than a week ago with the Easter holiday. But interestingly, it’s basically the same number as the same week last year, which was not a holiday week. Last year Easter was at the end of March. There are more sellers each week now. I fully expect that trend to continue.
There are still new listings that take offers and go immediately into contract. We call those the immediate sales, but there’s only 13,000 of those. The rate of immediate sales is declining and is a good indicator of organic levels of demand. If there are homebuyers out there shopping, they jump on the best properties as soon as they can.
Likewise, when demand weakens, the immediate sales numbers drop quickly. Buyers wait. And notably, last year at this time the percent of immediate sales dropped rapidly when mortgage rates spiked. This rate is also dropping again right now, in April, with the recent spike in mortgage rates.
So this implies that in next week’s report, we’ll see new listings jump back close to 80,000. We have more sellers each week now than we’ve had at any time in the post-pandemic era. It’s still slightly fewer sellers each week than the old days like 2017, 2018, and 2019.
Basically, the market on average nationally is back to normal.
In this chart, the purple line for 2025 dipped a bit this week. Don’t read too much into the holiday. It will jump back up to the old levels next week. I’m looking for 80,000 new listings unsold next week. If it comes in higher than that, like 84,000, that would be a notable move.
The trend isn’t the same nationally, of course. The low for home supply is Connecticut, my proxy for all of the northern markets where inventory remains very tight.
It is the only state where the active inventory of unsold homes is still less than a year ago. But there are about 3% more new listings each week in Connecticut than last year. So there is some little growth in supply. In Florida, on the other hand, there are 12% more new unsold listings each week than a year ago. Condos in Florida are even slower.
Home prices
Let’s take a slightly different view of home prices this week than we have recently.
This is a long-term view of the median price of all the active inventory, which is now just over $453,000. I like this view of the active market because it tells us if you walk into the market today, this is what you can buy. The median sales price is just under $400,000, but the homes available to buy are more expensive than that.
This chart tells a really important story about the housing market. The first thing you notice is that after the steep home price climbs of the pandemic, home prices have been basically unchanged for three years. There’s no sign that home prices will move higher this year either. So think about what this means for affordability. Home prices rose 35% in just three years, but haven’t moved at all in the three years after that. So what was 13% per year of home price appreciation is now less than 6%.
Meanwhile, incomes have grown, so homes have actually improved in affordability recently. I have a series on housing affordability coming out on HousingWire starting this week. Look for that if you’re interested in the dynamics of this market and what happens next for housing affordability in America.
For now, the takeaway on home prices is that they remain just a fraction ahead of last year, whether you’re looking at the ask price like here, which is $453,000 and not quite 1% more expensive than a year ago, or if you look at the weekly pending home sales where the median price is $399,999 this week and just fractionally above last year at this time. There’s no signal anywhere in the data that says home prices are going to break higher. So I expect a fourth year in this pattern that we see here.
Price reductions
The percent of homes on the market with price cuts ticked up a bit this week, up 40 basis points to 35.9%. A 40-basis point move in April is not catastrophic, but it sure doesn’t show demand accelerating.
As a reminder, what this stat tells us is that homes on the market now that don’t get expected offers have the option of cutting their price. Last year at this moment, price cuts started picking up. As I pointed out above, home sales hit the brakes hard in May 2024 with the spike in mortgage rates at that time.
You can see that demand shift here in the blue line from 2024. Do you see this inflection point? At that time, mortgage rates jumped to 7.5%, buyers stopped, and the weekly pending home sales rate peaked in April and fell in May, which is unusual.
Since those sales were stalled, homesellers cut their prices to attempt to stimulate demand.
The takeaway from price reductions as we roll into May is that our comps with 2024 get a lot easier. At the current pace, we should see the headline sales numbers not show great gains, but the headlines will say things like April and May home sales are growing. So, for the next couple of months, expect those headlines to actually sound a little bullish to prospective buyers and sellers.
The headlines are going to say growth. That is, of course, unless something crazy hits our markets and the current trends change quickly. That is a real risk, but one which we don’t have any capacity to predict. We have to just keep our fingers crossed for a little normalcy.
First Time Home Buyer FAQs - Via HousingWire.com