

Why aren’t home sales crashing as they did in 2022? Right now we have elevated mortgage rates, trade war uncertainty, rising property taxes and home insurance, terrible consumer confidence data and a downgrade of the government’s debt, among other factors. But, housing demand continues to hold up, surprising people who can’t explain why home sales aren’t crashing anymore given elevated mortgage rates. So, let me try to make sense of it.
Remember, the bar is so low we can trip over it, but millions of people buy homes every year and we are still on pace to have nearly 5 million total home sales in 2025.
Purchase application data
In a total shocker for 2025 — which is receiving no airtime whatsoever — purchase application data from last week showed 20% year-over-year growth and 10% week-to-week growth. People have no idea what to make of this data line in 2025, so most tend to ignore talking about it. I wrote this article last week to give some perspective, but last week was one of the best weeks in years.
Here is the weekly data for 2025:
- 11 positive readings
- 8 negative readings
- 3 flat prints
- 19 straight weeks of positive year-over-year data

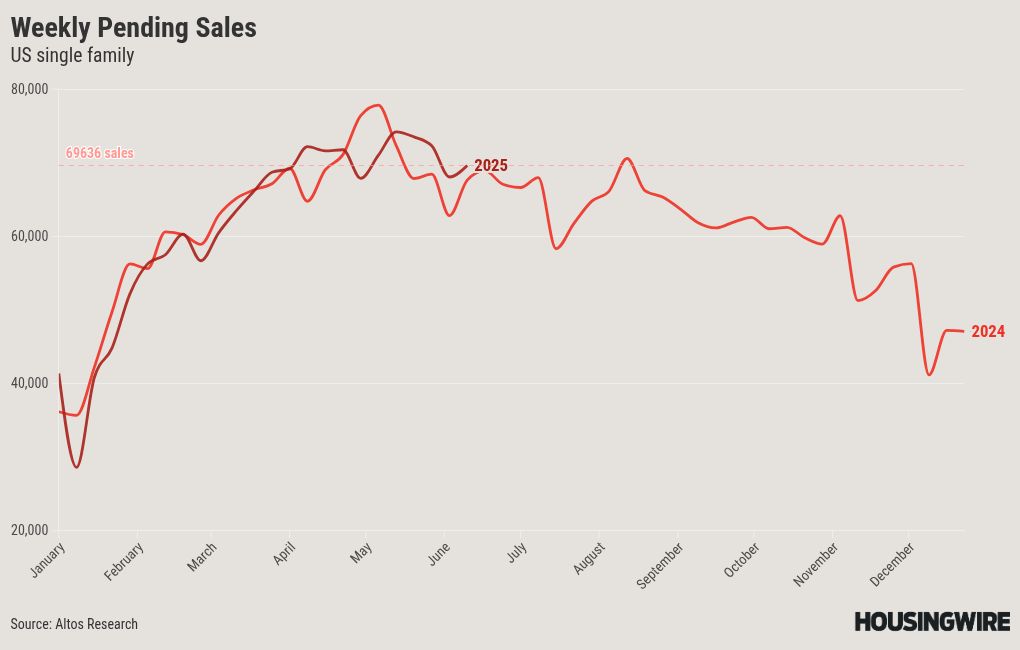
Weekly pending sales
Our weekly pending home sales provide a week-to-week glimpse into the data; however, this data line can also be impacted by holiday weekends and any short-term shocks. Last week’s data was a bit soft, most likely due to the holiday weekend, but we saw a bounce back in sales and we are still showing year-over-year growth with mortgage rates near 7%.
Weekly pending sales for last week over the last two years:
- 2025: 72,039
- 2024: 68,916

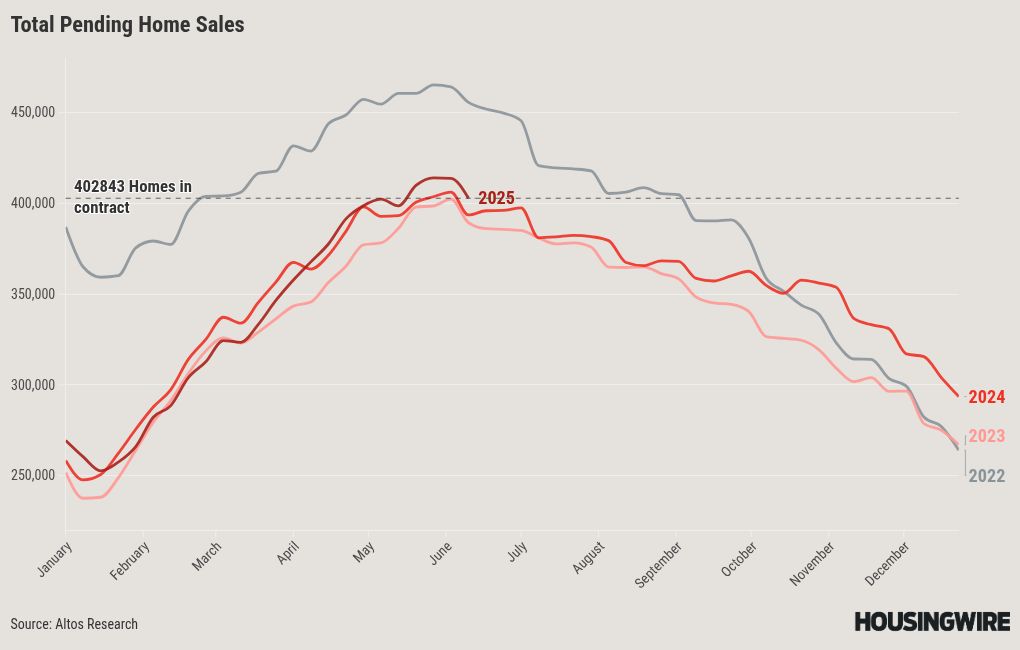
Total pending sales
The latest weekly data on total pending sales from Altos offers valuable insights into current trends in housing demand. Typically, mortgage rates around 6% are necessary for significant growth in the housing market. Although total pending home sales are slightly higher than last year, it’s surprising to see this data remain steady despite elevated rates in 2025. The seasonal peak period for our data has ended.
Weekly pending sales for the last week over the past several years:
- 2025: 405,489
- 2024: 395,923
All in all, the housing market is not only experiencing a healthier inventory year, but demand is holding up even with elevated mortgage rates, crazy headlines and one bear market print in stocks. Not too shabby if you ask me.
10-year yield and mortgage rates
In my 2025 forecast, I anticipated the following ranges:
- Mortgage rates between 5.75% and 7.25%
- The 10-year yield fluctuating between 3.80% and 4.70%
We had an eventful week, as both inflation reports came in tame, taking the 10-year yield to as low as 4.32% on the night when Israel attacked Iran. However, we saw no push into the 10-year yield or the U.S. dollar as a safety play on Friday as stocks sold off. All in all, mortgage rates didn’t move too much, as we went from 6.95% to 6.85% and ended the week at 6.89%. Improved mortgage spreads do limit the upside damage in mortgage rates when the 10-year yield rises.
Mortgage spreads
Mortgage spreads have been elevated since 2022 but have improved since their peak in 2023. We experienced some drama with the spreads as the markets dealt with the tariffs, but things have improved as the market has calmed down. It’s been critical to see spreads get better on days when the 10-year yield goes up because that limits the damage of a higher 10-year yield.
If the spreads were as bad as they were at the peak of 2023, mortgage rates would currently be 0.71% higher. Conversely, if the spreads returned to their normal range, mortgage rates would be 0.79% to 0.59% % lower than today’s level. Historically, mortgage spreads have typically ranged between 1.60% and 1.80%.
Weekly housing inventory data
The most significant development in the housing market for me has been the growth of inventory in 2024 and 2025. As someone who described the housing market as unhealthy in late 2020 and savagely unhealthy in early 2022, the inventory growth we’ve experienced over the past two years has been a blessing. Two weeks ago, the increase in inventory was a bit slow, but we had a good pick-up up this week, as the housing market is heading back to normal inventory levels, which will lay the foundation for many years to come.
- Weekly inventory change (June 6-June 13): Inventory rose from 808,564 to 825,761
- The same week last year (June 7-June 14): Inventory rose from 611,543 to 620,622
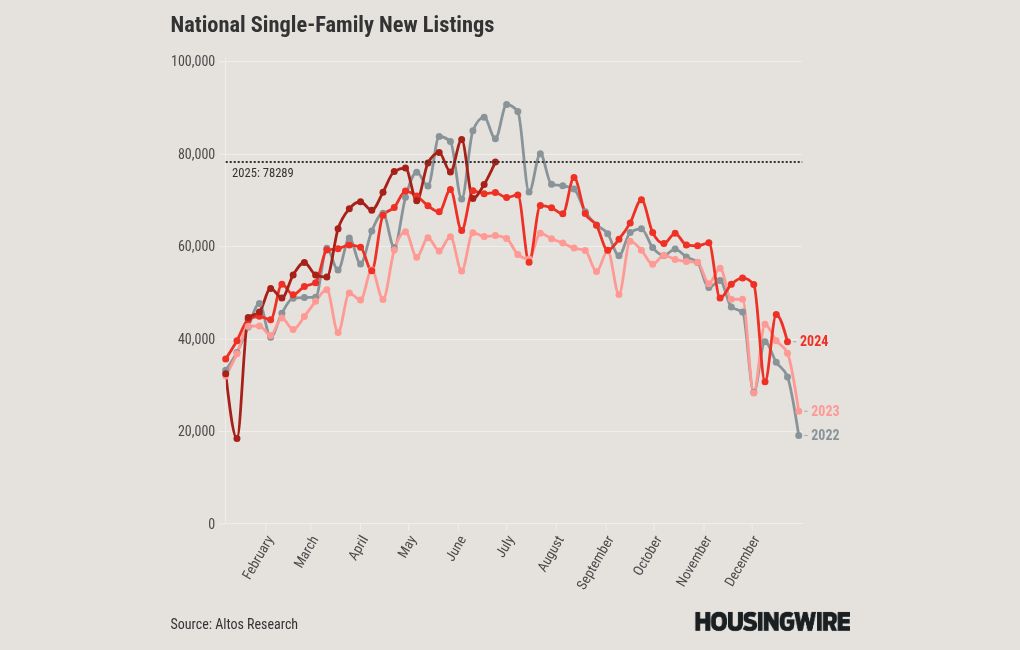
New listings data
One of the forecasts I got wrong last year was that the new listings would reach at least 80,000 per week during the seasonal peak period — that didn’t happen. This year, I have maintained that forecast and we have exceeded 80,000 twice so far. However, over the last two weeks, the growth has been slower than I expected. I was hoping to see some weeks with numbers ranging between 80,000 and 100,000, but I am running out of time for that to occur. We did see a bounce this week, but again, lower than I would have liked.
To give you some perspective, during the years of the housing bubble crash, new listings were soaring between 250,000 and 400,000 per week for many years. Last week’s new listings data over the past two years:
- 2025: 78,289
- 2024: 71,486
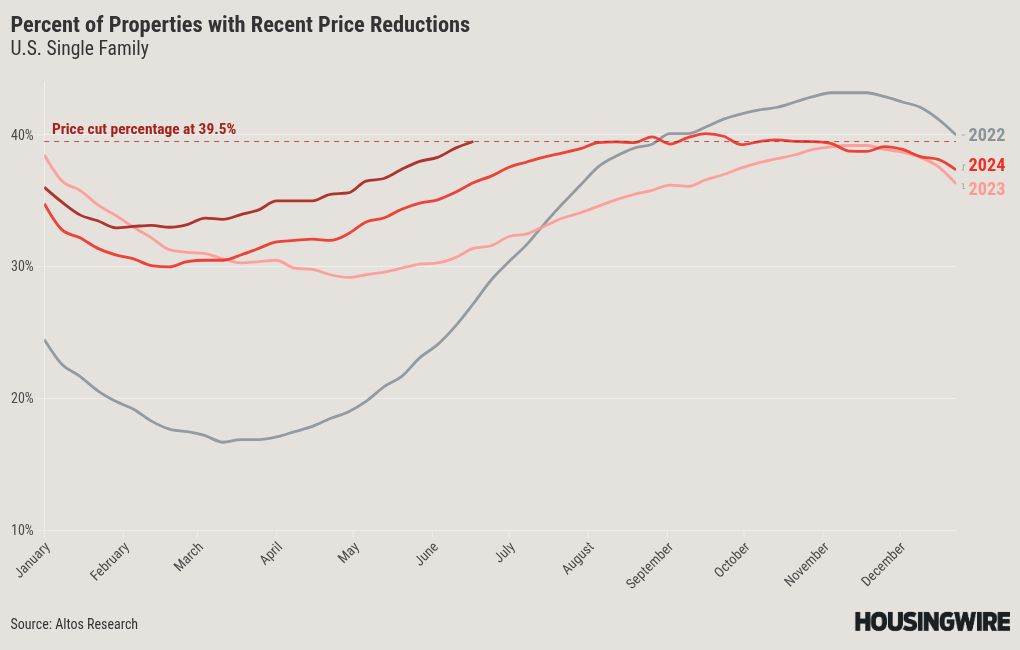
Price-cut percentage
In a typical year, about one-third of homes experience price reductions, highlighting the housing market’s dynamic nature. Many homeowners adjust their sale prices as inventory levels rise and mortgage rates stay elevated.
For my 2025 price forecast, I anticipated a modest increase in home prices of approximately 1.77%. This suggests that 2025 will again see a negative real home price forecast. In 2024, my forecast of a 2.33% increase proved inaccurate, primarily because mortgage rates fell toward 6% and demand improved in the second half of 2024. As a result, home prices ended up increasing by 4% in 2024.
The rise in price reductions this year compared to last year reinforces my cautious growth forecast for 2025.
- 2025: 39.5%
- 2024: 36%
The week ahead: Fed week, Israel and Iran, retail sales and housing starts
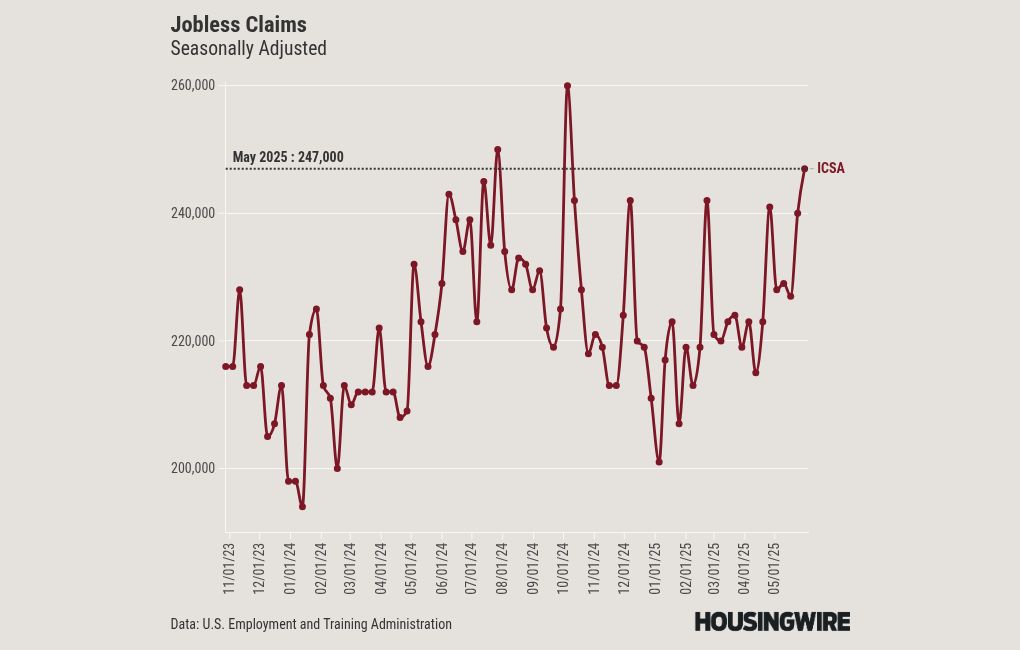
Do I need to add anything beyond that headline? We have an enormous week ahead with significant data releases, a Federal Reserve meeting and ongoing questions surrounding the war in the Middle East. Additionally, jobless claims have been trending upward lately.
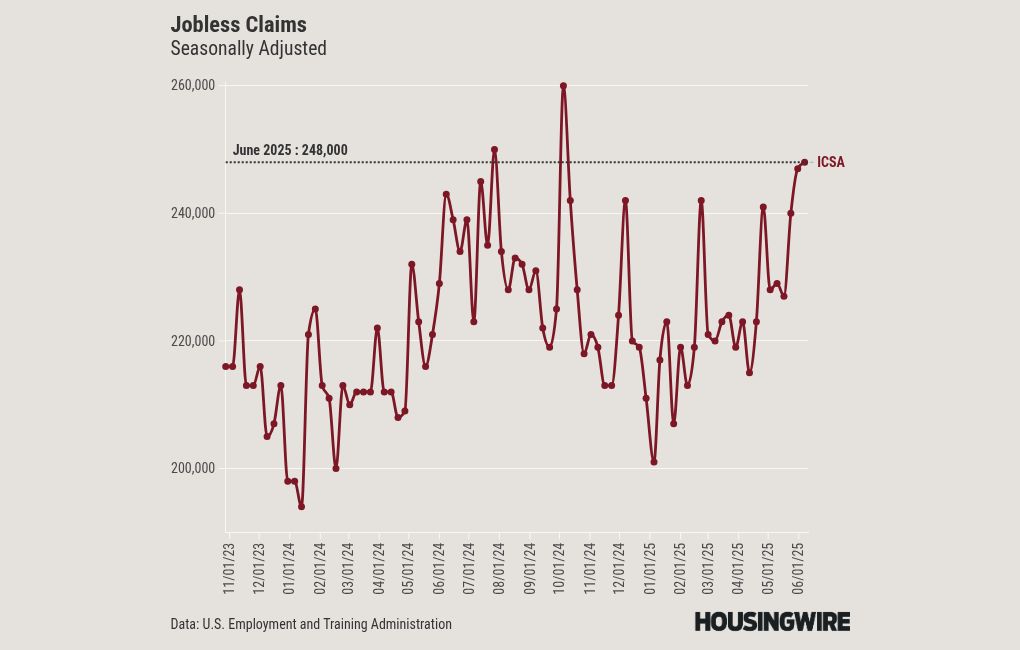
The key for the Fed meeting is to listen to their language on the risk of labor versus inflation, since the labor data has become softer but the inflation data has not yet worsened. As always, I’ll be keeping a close eye on the data this week.
First Time Home Buyer FAQs - Via HousingWire.com