

Weekly pending home sales disappointed in the last week of April, with 10% fewer than the same week in 2024.
To be specific, single-family home sales came in 8% fewer than the same week last year, and condo sales came in 19% fewer. Nationally, weekly pending home sales saw only a small rebound after the Easter holiday from two weeks ago.
It’s not only in the transaction count. Prices looked soft last week too. The median price of the weekly pending sales came in below the same week last year.
That’s the first negative year-over-year reading in nearly two years. This is one week of negative home prices nationally.
One week is not a trend — it could rebound next week — but it is notable that this is the first negative reading after the annual rate of home price change has been slowing all year.
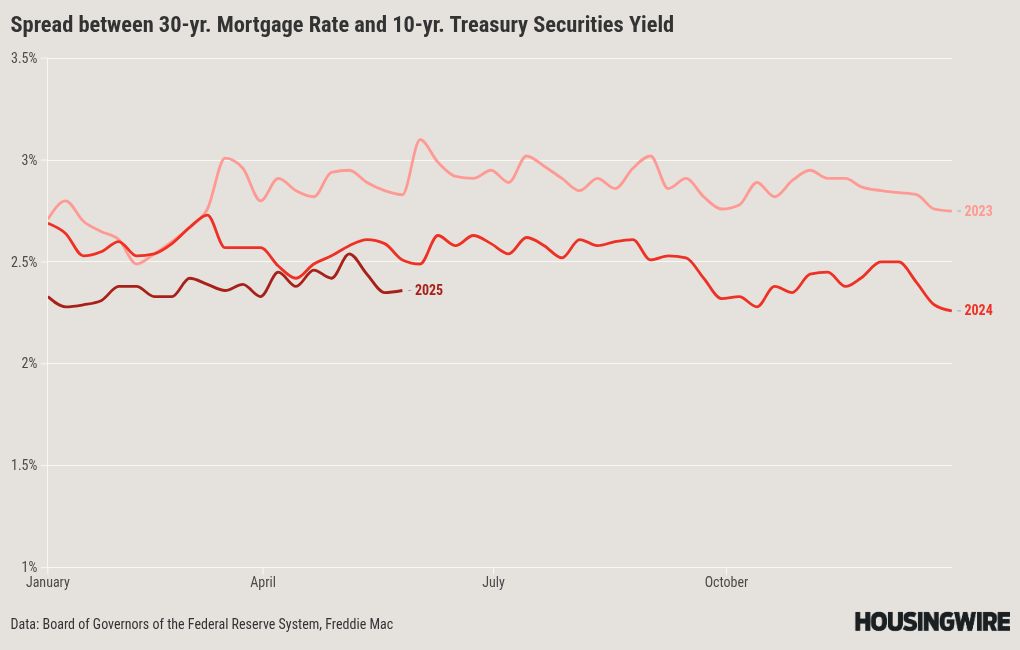
During the week, mortgage rates inched lower, so the typical mortgage payment for a homebuyer is now nearly 6% cheaper than for buyers a year ago. The average 30-year fixed-rate mortgage is still almost 7%, so there is very little incentive for potential buyers sitting on the fence.
Meanwhile, the unsold new listings rate surged in the Northeast this week.
Connecticut, New York, Massachusetts, New Jersey, and Pennsylvania all had significant rebounds in new listings after the Easter holiday. These states are where inventory and weekly new listings have remained very constricted. In some cases, the available inventory of unsold homes is still barely above the pandemic crisis shortage levels.
So, a little growth in seller volume in these states is welcome. Stay tuned to see if that trend continues.
Weekly pending home sales
We track every home that takes an offer and goes into contract each week across the country. Homes typically take 30 to 40 days in contract to close the sale. Not every home in contract will close, but this number is a very good proxy for May home sales, which will be in the headlines in a couple of months.
And… home sales were clearly sluggish at the end of April.
We counted only 71,000 new contracts for single-family homes this week. That’s up 4.6% over the previous week, which included the Easter holiday. But it came in 8.7% fewer than the same week in 2024.
In this chart, you can see this year’s purple line has come in under 2024 for a couple of weeks. Two weeks ago included the late Easter holiday, so that’s no surprise. But this week did not rebound nearly as much as I’d expected.
I do think that next week home sales will come in slightly better than 2024. Last year at this time was rough. Mortgage rates were jumping to 7.5%. Starting next week, the year-over-year comparisons get very easy. Also, we have not yet reached the seasonal peak of buying activity. With the late Easter, that peak is probably not until later in May 2025. So, we should see several weeks of increasing transaction counts until the Memorial Day holiday when the market pauses again.
The takeaway for home sales; April started with home sales growth over 2024 but ended with fewer.
May should see mostly more home sales than last year. If next week we see only 72,000 weekly pending home sales, that’d be a bearish signal — and you can be sure I’ll highlight it next Monday. Stay tuned.
Home prices
As I mentioned, the soft data came in not only in transaction volume but also in prices. The median price of the newly pending home sales this week was $395,000.
That was down by 1% for the week, and home prices this week were lower than the same week in 2024.
For the last few years, the story has been that home sales are low, but home prices are still up year-over-year. Home prices kept climbing even as demand weakened to very low levels over the past several years.
Why did home prices keep rising? Well, the supply of homes to buy was still quite restricted. There were very few new listings each week and still restricted levels of unsold inventory nationally.
Now, after three years of rising inventory, we’re finally out of that shortage — but demand hasn’t recovered. So, we’re now at a point where rising supply is great enough to impact prices.
This chart of the weekly pending home sales prices is very useful. You can see how, even in the face of slow sales, the blue line for 2024 prices stayed elevated over 2023. Prices moved higher.
And again, this year, the purple line for 2025 has been every single week all year just a little ahead of last year. But this most recent reading, at the end of April, dipped below last year. Last year the median price of single-family homes newly pending was $399,000. This year it’s $395,000.
As I’ve said before, one week is not a trend. Prices will probably rebound a bit next week, but any negative year-over-year reading in home prices is very unusual. You can see the green line from 2022, when the market was slamming on the brakes — prices adjusted down that year too. So, one week is not a trend, but there’s nothing positive in this reading.
We can get signals with leading indicators of future sales too. The median list price and the price of the new listings both ticked up for the week and are running about 2–3% ahead of last year.
This combination tells us that we’re aiming for zero percent home price change on average across the country. The big thing I’m watching for in home prices is any big shock. For example, mortgage rates spiked with the tariff announcements a month ago, and if that happens again, home prices are very fragile.
Inventory
Home sales are down, so inventory grew by 2% this week — a solid rebound after the Easter holiday.
Even though there are still not a ton of sellers each week in most of the country, slow sales mean that unsold inventory builds.
As I mentioned, the supply of homes on the market is finally ample enough to impact prices. In fact, there are more homes on the market now than at any time since before the pandemic.
We know that inventory has been up across the Sunbelt, but I’m watching the Northeast now to see if that part of the country is finally catching up with some supply. Plus, we have a whole summer of inventory growth still to come. So this story isn’t over.
See the purple line here for the 2025 inventory curve. There are 744,000 single-family homes unsold on the market across the country. That’s 33% more than last year. It’s more than the peak of 2024, which came not until October. It’s more than April of 2020, when due to the pandemic demand boom, inventory started falling rapidly each month.
In this view, it’s very easy to see how we end 2025 with an end to the pandemic shortage that we’ve faced for five years. Time for a new era and new assumptions about the housing market.
New listings
There were 78,000 new listings unsold for single-family homes across the country last week. That’s 10% more than a year ago. So, inventory is building. That was a 12% rebound after the Easter holiday.
But, in fact, it’s actually fewer new listings than I expected. I was looking for 80,000 single-family homes to be newly listed for sale, and we came in at 78,000. I’ll look for 80,000 again in the coming week’s data. I think we could see that 80k threshold for the first time in next week’s data.
New listings rebounded 12%, but sales only rebounded by 5%. And new listings could continue to accelerate. One thing to watch in the new listings data is if the slow sales also put a ceiling on new listings. If I’m not buying a house, I’m not selling my current one.
So, if new listings hit a cap and retreat back to the levels of the last few years, that’s a bearish signal. That’d be not healthy for housing.
In this chart, the purple line of this year’s weekly new listings had been approaching the old normal levels at the top of the chart. The end of April didn’t get to 80,000, and you can see the purple line is sagging down to the set near the bottom of the chart. Let’s see next week if we get some growth.
Compounding with the seller volume is the fact that there are dramatically fewer immediate sales happening now than in recent years. Only 15,000 new listings went into contract immediately after hitting the market at the end of April.
All in all, there were just 1% or so total more sellers than last year at this time. This might be a signal of both buyers and sellers getting chills. Again, if that continues, that’d be an unhealthy sign for housing.
Price reductions
Let’s wrap today looking at the leading indicators. As inventory grew and transactions disappointed, it’s not surprising that we measured a bit of a surge in price cuts at the end of April too.
The percent of homes on the market with price reductions rose 60 basis points to 36.5% of the market. You can see the 2025 line here remains elevated compared to any recent year. This shows us significantly weaker home price pressures than we’ve had since 2022.
Price reductions can change course when demand kicks in. If mortgage rates were to fall like they did in September last year, we would see buyers come off the fence, make offers on homes, and we’d see the uptick in demand flatten this curve out — like in the 2024 blue line later last year. There is no sign of that happening now. This is another way to know that the supply of unsold homes is plenty big to impact prices.
The takeaway on price reductions is that it’s just another data point that reinforces today’s message. Home sales disappointed at the end of April. Sales are down, and prices are down. Consumers are waiting for conditions to improve — and they have not.
That’s all the data we have time for. This market is changing quickly. If you need to be on top of it, I highly recommend that you join us at HousingWire and Altos Research.
First Time Home Buyer FAQs - Via HousingWire.com