

To start things off, I have an announcement to make, today will be my last weekly article for Altos Research.
I founded Altos nearly 20 years ago to bring a new level of analytics and data to the housing market. Two and a half years ago, Altos was acquired by HousingWire, and it’s been tremendously beneficial for both companies.
I’m now stepping out of the day-to-day operations and handing off to the incredible team at HousingWire, led by my good friend Clayton Collins.
I’m confident the data and the company are in great hands.
I’ll still play an advisory role and will continue to contribute to HousingWire with a monthly column on the market. If you’re not a HousingWire subscriber, please join us.
I will also continue to share regular insights on the housing market via my own social channels, including Twitter and LinkedIn.
Make sure you’re following me there if you’d like to keep up with these. I’ll also be sharing details about a fun new project I’m working on very soon, so watch out for that.
I am deeply grateful for the team at HousingWire and especially for all of you in the audience. I’ve done these weekly videos and articles every single week for over five years with almost no break, and it’s really been a labor of love for me. And while I do all the talking in these, what’s really happening is that I am learning. So thank you for this incredible opportunity for me to learn and to serve you all these years.
OK — let’s get to this week’s data. It’s a pivotal time in the housing market. There are three big trends for this summer’s housing market:
- Unsold inventory of homes on the market continues to grow. There are 33% more homes on the market now than at this time last year. Even the Northeast is growing a bit. Connecticut finally has inventory growth over 2024. Not a ton, but it tells us that basically everywhere in the country, inventory is climbing.
- Home prices are flat or a tiny bit below 2024. Supply is great enough now that home prices in most places are very sensitive and ready to drop if buyer conditions get worse.
- For the rest of May and June, despite the fact that homebuyer demand is still very light, we’re likely to see notable home sales gains over 2024. For years, the headline has been “Home sales are down, but prices are up.” The message for the rest of the summer is likely to be “Home sales are up, but prices are down.”
Let’s get to the details in this week’s data.
Inventory
There are now 768,000 single-family homes unsold on the market. In fact, there are now more homes on the market than we counted at the beginning of 2019. Inventory is back to pre-pandemic levels. Now, to be clear, that’s still a lot fewer homes on the market across the country than almost all of the last decade, but it’s climbing. And the Northeast markets like Connecticut still have relatively tight inventory. So the buildup of unsold homes is mostly across the Sun Belt.
This suggests that there are likely several more months of inventory growth, as the Northern markets have a lot of room to expand. So we’ll end 2025 back in much more normal levels of unsold inventory on average across the country.
In this chart, we have the last decade of inventory trend with unsold single-family homes, and it’s really easy to see how the number of unsold homes on the market has climbed right along with interest rates over the last three years. 768,000 single-family homes are on the market now. That’s up 1.5% for the week and is almost 33% more homes on the market than last year.
At the right end of the chart, you can see that the weekly climb is still heading up. In the old times, inventory would peak in August. In the post-pandemic years, the season has stretched and unsold inventory kept climbing until October or even November.
So this year by Q4, we’ll probably have 900,000 single-family homes on the market. And if mortgage rates rise, like they’re doing today, it could be even more than that.
New listings
The other part of the supply equation is how quickly sellers are entering the market. This week, we counted 76,000 new single-family listings unsold, with another 14,000 new listings as immediate sales, so that’s 90,000 total. That’s 8% more sellers than a year ago across the country. That’s a hefty jump from 2024, though it’s 5% fewer than last week — a little dip for the week.
This mid-May period is when we typically see the most sellers hit the market. This is it — we’re roughly at peak housing market for 2025 right now. So if you’re expecting some kind of oncoming flood of sellers that will tank home prices, it looks like you’ll have to wait another year.
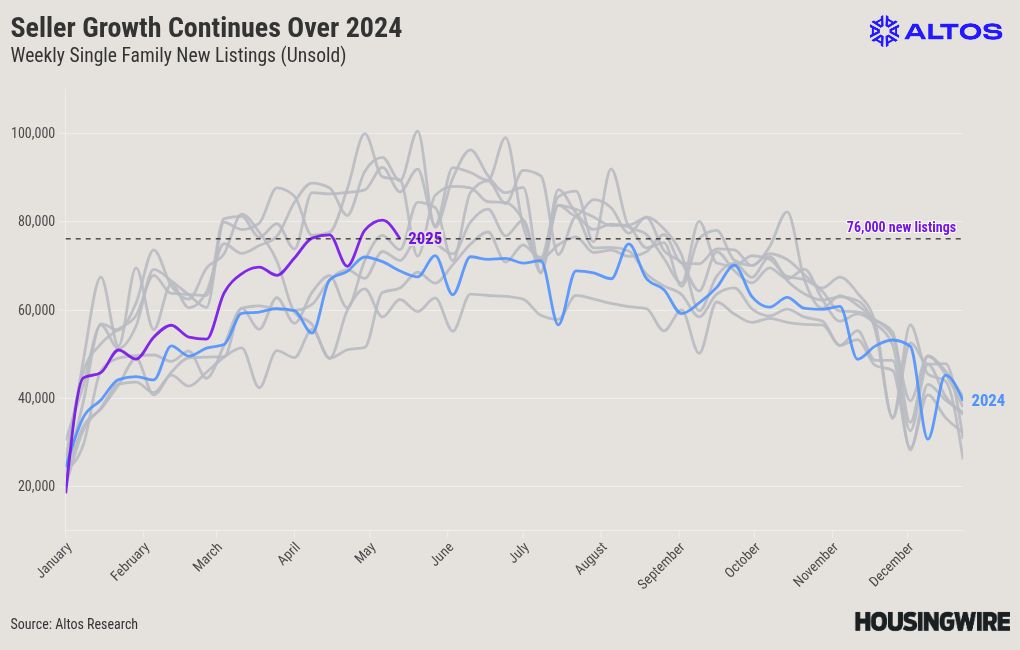
In this chart, the purple line is this year. We have one more week for home sellers before the Memorial Day weekend. And I expect this coming week will have the most new listings of the year. We’ll have a few good weeks in June after Memorial Day, and then the late-season decline starts with the July 4 holiday.
What we can see here is that there will continue to be more sellers than a year ago, but since right now is roughly the peak for the year, there is no sign of any flood of sellers. Nobody’s panicking. In 2022, the market was totally tanking at this point in the year, so new listings volume kept growing all the way until July.
But that’s not happening now. So next week’s data — or maybe mid-June — will show the most new listings of 2025.
Interestingly, the condo market had already slowed by this time last year, so the condo new listings volume is about the same as it was then. While there are 8% more single-family home sellers now than the same week in 2024, condo sellers are about the same. 16,000 newly listed condos were unsold this week.
Weekly pending home sales
On the Weekly Pending Home Sales numbers, I’ve been talking about this coming trend for a while. The year-over-year weekly pending home sales rate is starting to show growth. This is mostly because last year was so weak and getting slower by midsummer. Last year, there were only 68,000 single-family home sales contracts started.
This year, we counted almost 74,000. So the year-over-year home sales growth is 8.3% now. This is not because demand is strong, but because it was so lousy last year at this time. I expect that you’ll hear the headlines report annual home sales growth for May — even as April finished really poorly. The headlines will finally shift.
Cumulatively year-to-date, we’ve still sold almost 3% fewer homes than we had in 2024 through mid-May — the first 20 weeks of the year.
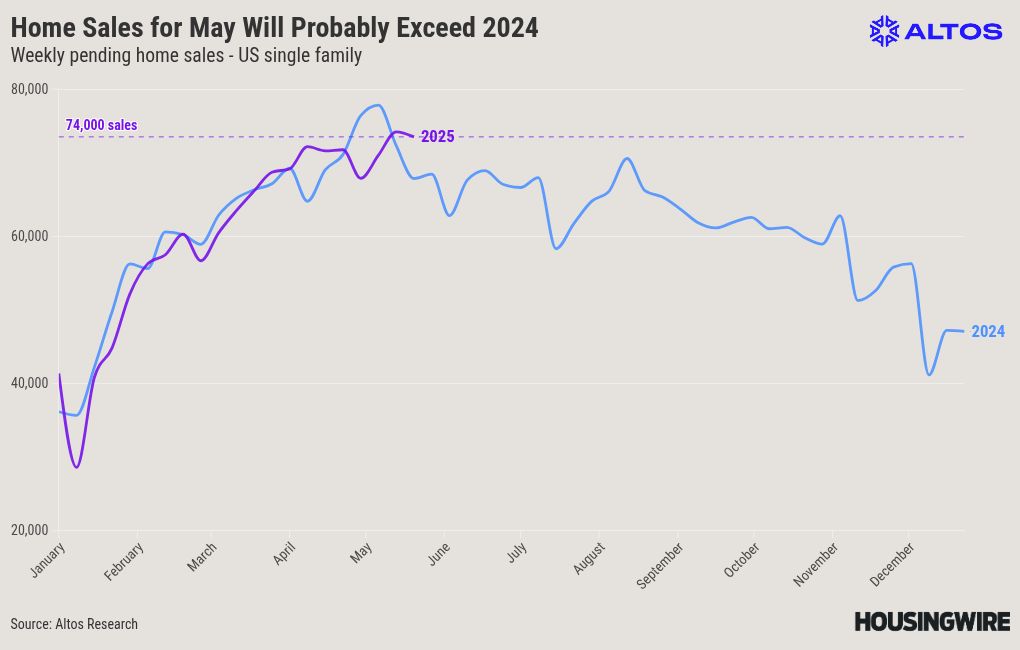
In the chart here, you can see the purple line has been below the blue line from 2024 for most of the year.
But this week saw 8% more transactions than the same week a year ago. Next week, the comparison is easy again. You can see that in this chart. The purple line for this year is now well above last year’s obvious slowdown levels. We’ll see one more week with newly pending single-family home sales, probably in the mid-70s, before the Memorial Day holiday dip.
The takeaway here is that I’m pretty convinced home sales are about to consistently report higher than 2024 for the next couple of months.
Home prices
I keep asking myself, what’s the right way to talk about home prices in 2025? Is the headline that home prices are below last year? Or is it more accurate to say that home prices are basically unchanged? There are now nine states where home prices are at or below 2024 levels. But that includes Texas, Florida, and Georgia — and just those three states account for 35% of the U.S. housing inventory. States like New Jersey and Connecticut have rising home prices, but those are tiny parts of the market.
The median price of the weekly pending single-family home sales is $400,000 now. That’s just a tiny increase from a week ago and is just a quarter of a percent more than last year. Home prices nationally are basically unchanged from last year. The last two weeks came in below 2024; this week is just above.
Seasonally, home prices (of the weekly pending home sales) are roughly at their peak. Some time in the next few weeks, prices will begin the long seasonal decline. In 2022, prices peaked earlier in the year because mortgage rates were rising rapidly. In 2023, the opposite was happening, so prices didn’t peak until early July.
Last year, mortgage rates spiked again in May, so prices peaked in early May. This year, rates have been inching higher — they’re definitely not improving buyer demand — so there is no action to push home prices up from here. Therefore, look for the 2025 peak in home prices to be sometime in May or early June, right about $400,000, where we are today.
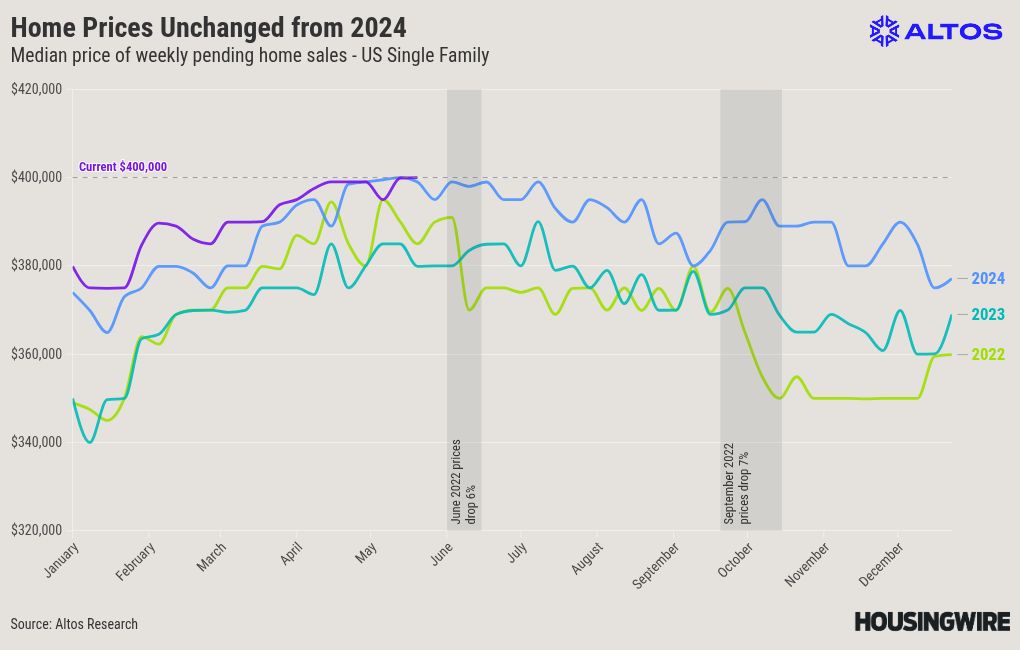
I do a Twitter poll once a month on people’s expectations for home price changes for the year. There are a lot of folks out there who read these slightly negative home price trends as an indication of a coming crash. As always, there are people who expect home prices to crash. I’ve got news for you: that ain’t happening in 2025.
Even though the news right now is that by some measures, home prices are a little below last year at this time. That’s it. It’s a little below. The signal here is that home prices are very sticky. Demand is light, supply is growing, so there’s no upward pressure on prices. But there is no catalyst for a price crash unless we have some major economic catastrophe.
While this economy has a lot more risk of some crazy shock, that shock is not in the data yet. Employment is still good. Inflation is still pretty good. Home prices might end 2025 below 2024, but it’s on the order of a couple percent.
Price Reductions
And we can reinforce this forecast by looking at the price reductions. Price cuts are on the rise again. This is an indication that while home sales are likely going to keep increasing, home prices are not.
There is more supply in most of the country and not that much demand. 37.4% of the single-family homes on the market have taken a price cut. That’s up 60 basis points for the week.
At this point in the home buying season, price cuts are almost always climbing. These are the folks who listed their house in March and haven’t had offers yet. But because there are so many more homes on the market in much of the country, seller competition is greater — so more sellers decide each week to cut their asking prices to stimulate demand.
At this pace, over 40% of the market in June will have had a price cut. Home prices are not going higher from here this year. Now, this trajectory can change quickly with, for example, a notable dip in mortgage rates. That’s what happened last September. And you can see that in the blue line for 2024 in this chart.

2025 has been a huge disappointment for homebuyers, with stubbornly high mortgage rates all year long. If economic conditions conspire to get a nice dip closer to 6% for the 30-year fixed mortgage, then you’ll see a lot of pent-up buyer demand jump into action. That will keep a lid on price reductions and maybe the year will end with slightly positive home price appreciation. The lesson, though, from the last three years is that you can’t bank on mortgage rates falling, unfortunately.
Closing
Well folks, that’s the last of my weekly articles for Altos Research. I’ve done over 250 of these. The big lesson is that no matter what our expectations are, we have to let the data tell the story. Don’t let your story dictate the data.
I appreciate all of you. I hope that you’ll connect with me on social media so we can stay on top of the data together. If you need to communicate about the housing market with buyers and sellers, you should go to AltosResearch.com and sign up so you can do this kind of work yourself. Thank you, everyone.
First Time Home Buyer FAQs - Via HousingWire.com