
Since President’s Trump Liberation Day on May 2, mortgage rates, the 10-year yield and mortgage spreads have been on a wild ride. It’s been so wild that the low end of my 2025 10-year yield forecast range of 4.70-3.80% for 2025 was almost officially met. However, last week, mortgage rates and the 10-year yield slowly moved lower as the week progressed. But can this last or will the trade war headlines drive volatility once again?
10-year yield and mortgage rates
In my 2025 forecast, I anticipated the following ranges:
- Mortgage rates will be between 5.75% and 7.25%
- The 10-year yield will fluctuate between 3.80% and 4.70%
Last week, we observed a positive trend, as the 10-year yield gradually declined from a high of 4.43% to 4.24%. This drop has also contributed to a slight decrease in mortgage rates. While mortgage spreads remain elevated compared to recent figures from 2025, the calm action last week is a relief to those trying to navigate this wild ride.
It’s important to note that, despite some softer economic data, key indicators such as retail sales, durable goods, new home sales and labor statistics remain steady. This resilience suggests that the harder data lines haven’t been hit by the trade war impacts yet.
As we navigate the complexities of 2025, we are addressing the balance between potential declines in economic data and the upward pressures on inflation resulting from supply shortages and rising inflation expectations linked to tariffs.
Ultimately, market trends will dictate the direction of bond yields and mortgage rates, and there is a sense of optimism that better news regarding the trade war can stabilize the markets. We can better respond to the changing landscape by staying informed on how the markets react to the data and headlines.
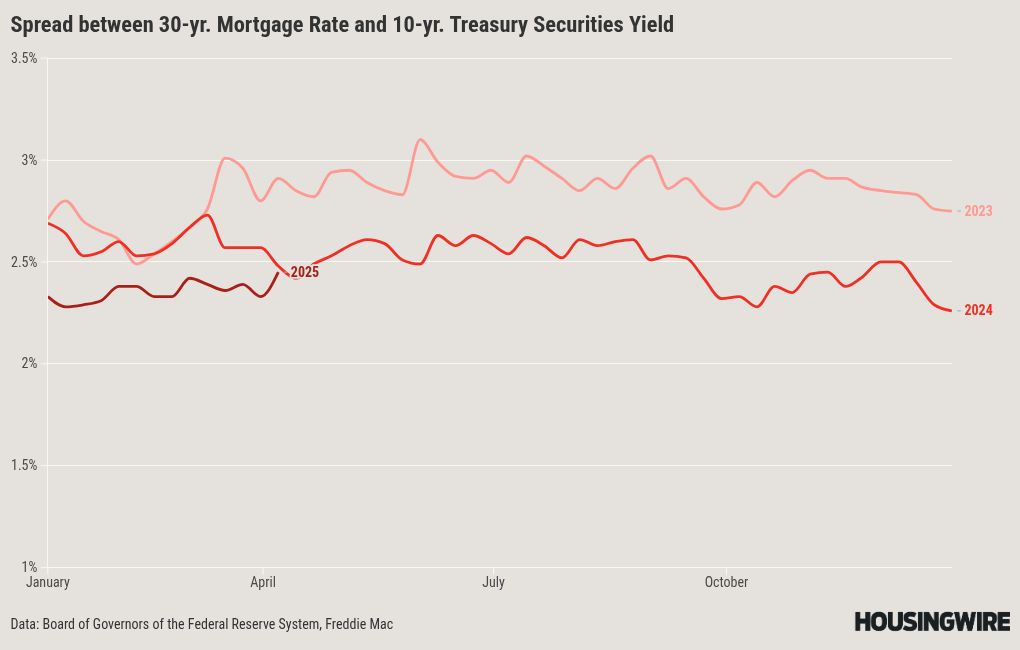
Mortgage spreads
Since 2022, mortgage spreads have been consistently elevated above historical norms, significantly worsening after the Silicon Valley Bank crisis in 2023. It’s clear that without this deterioration, we would not have experienced mortgage rates reaching 8% that year. However, starting in 2024, the spread improvement effectively helped lower mortgage rates.
In 2025, the spreads have performed better and improved when bond yields increased, reducing the damage of higher yields. However, recent market volatility has caused the spreads to widen, which has also prevented mortgage rates from being a bit lower.
If the spreads were as unfavorable as they were at the peak of 2023, mortgage rates would currently be 0.68% higher. Conversely, if the spreads returned to their normal range, mortgage rates would be 0.62% to 0.82% lower than today’s level.
Historically, mortgage spreads should range between 1.60%-1.80%.
Purchase application data
Given the recent rise in mortgage rates, I expected a more pronounced decline in the week-to-week and year-over-year figures for purchase applications. As illustrated below, the market was affected when mortgage rates increased from 6.54% to 7.10%. However, the decrease was less than I had anticipated. We shall see what happens this week now that rates have fallen slightly.
In the past few years, the forward-looking housing data tends to improve when mortgage rates fall from 6.64% to 6%. So, to have purchase application data still positive year over year in late April, with mortgage rates trending above this range most of the year, is an encouraging sign
Here is the weekly data for 2025:
- 7 positive readings
- 5 negative readings
- 3 flat prints
Total pending sales
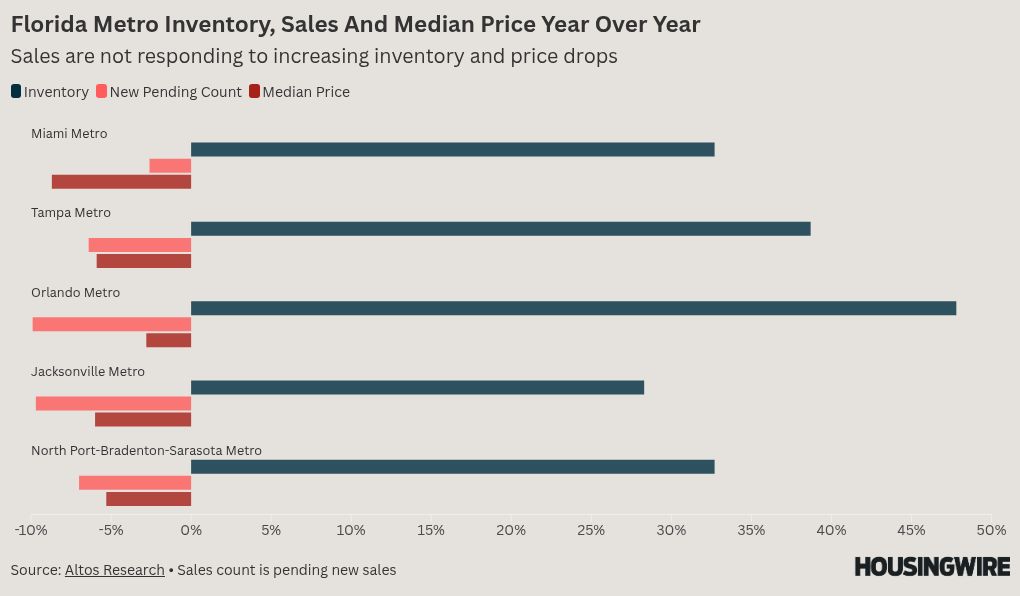
The latest weekly total pending contract data from Altos offers valuable insights into current trends in housing demand. Usually, it takes mortgage rates to trend closer to 6% to get real growth in housing. The data has been showing good progress with elevated rates, but the recent data has cooled down. While our total pending sales are slightly positive year over year, our weekly data has shown more softness that I would attribute to higher rates, rather than from the Easter holiday.
Weekly pending sales for the last week over the past several years:
- 2025: 398,736
- 2024: 398,097
- 2023: 368,113
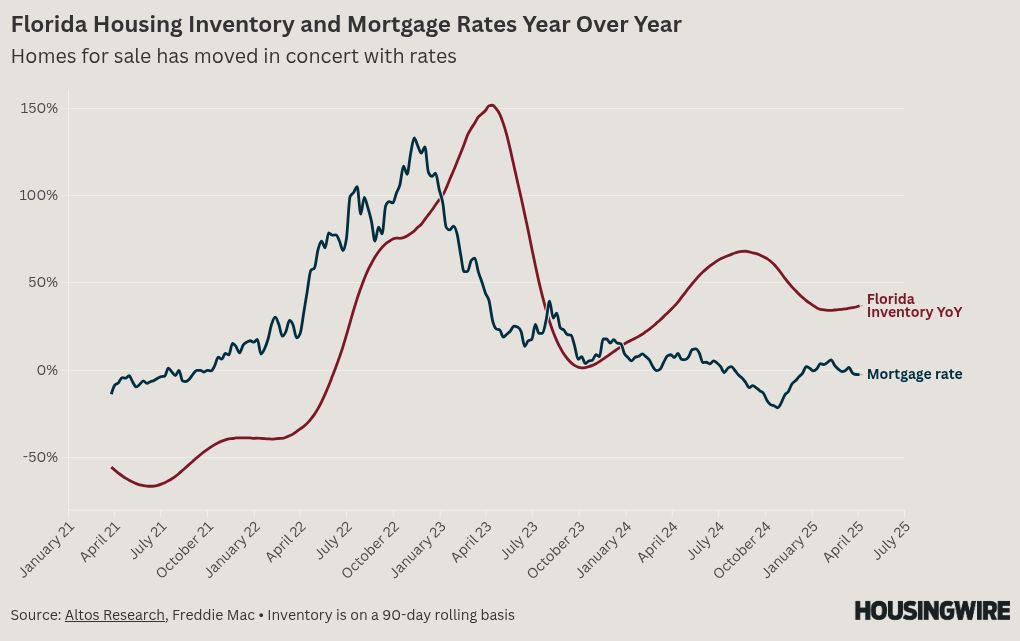
Weekly housing inventory data
The most encouraging development in the housing market for 2024 and 2025 is the increase in inventory. I explained the reasons behind this trend in an article on Friday. For the housing market to operate more effectively in the long term, it was essential to see a rise in inventory. As someone skeptical about the mortgage rate lockdown theory, I believe this inventory growth is a positive step in the right direction. While we haven’t fully returned to normal levels yet, we are progressing toward a healthier housing market.
- Weekly inventory change (April 18-April 25): Inventory rose from 719,400 to 731,989
- The same week last year (April 19-April 26): Inventory rose from 542,651 to 556,291
- The all-time inventory bottom was in 2022 at 240,497
- The inventory peak for 2024 was 739,434
- For some context, active listings for the same week in 2015 were 1,071,283

New listings data
The new listings data for the past two years has faced challenges, but now we see a promising shift. Last year, I projected that a minimum of 80,000 homes would be listed weekly during the peak seasonal months, and while I was off by 5,000, I remain hopeful for this year. We are on the brink of reaching that mark again. This last week saw a noticeable decline, but much of that concerns the Easter holiday. The fact is, 70%-80% of home sellers are homebuyers, so getting the new listing back to normal levels is a plus.
To give you perspective, during the years of the housing bubble crash, new listings were soaring between 250,000 and 400,000 per week for many years. The growth in new listings data is just trying to return to normal, where the seasonal peaks range between 80,000 and 110,000 per week. The national new listing data for last week over the previous several years:
- 2025: 69,891
- 2024: 72,089
- 2023: 63,236

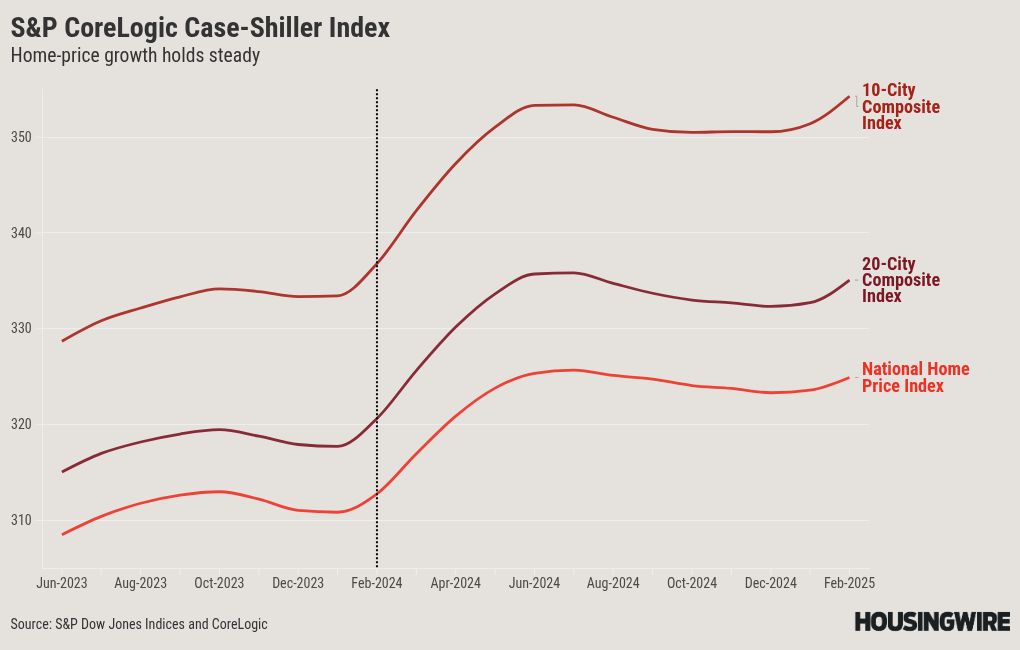
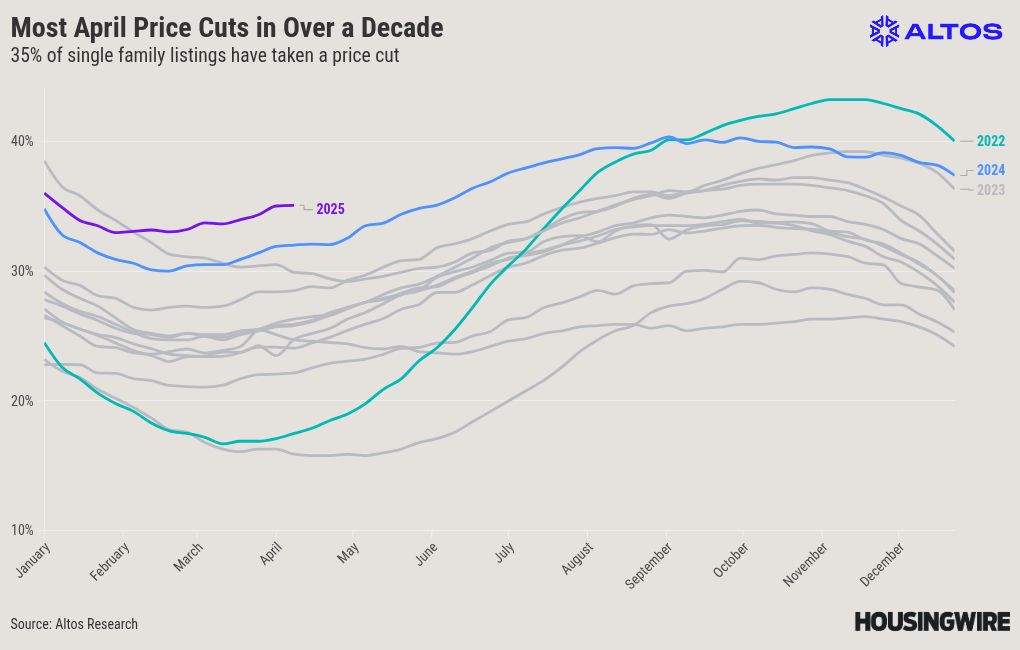
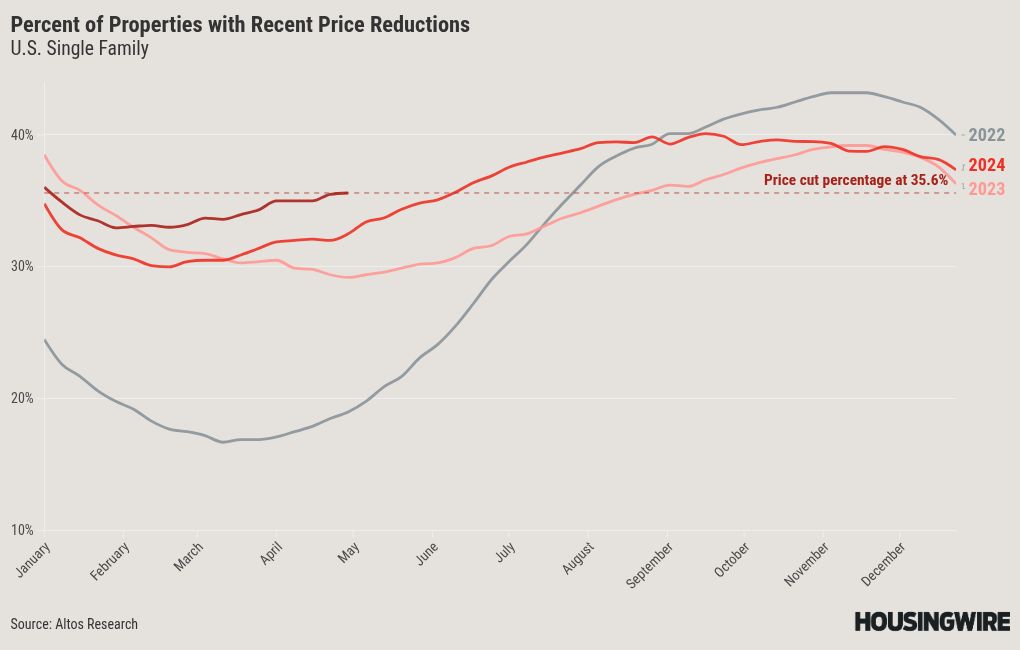
Price-cut percentage
In a typical year, about one-third of homes undergo price reductions, highlighting the housing market’s dynamic nature. As inventory levels increase and mortgage rates rise, many homeowners are making adjustments to their sale prices.
In my 2025 price forecast, I anticipated a modest increase in home prices of around 1.77%. This means yet another year of a negative real home price forecast for 2025. What can make my forecast wrong is a drop in mortgage rates to near 6%, which can make my forecast too low again. In 2024, my price forecast of 2.33% was incorrect as it was too low, and I lost it when mortgage rates headed toward 6%
The increase in price cuts this year compared to last serves as a valuable insight, reinforcing the validity of my conservative growth forecast for 2025. Below, you will find a summary of the price cuts from previous weeks over the last few years, which can provide further context for our evolving market conditions:
- 2025: 35.6%
- 2024: 33%
- 2023: 29%
The week ahead: Jobs and inflation data, plus crazy headlines
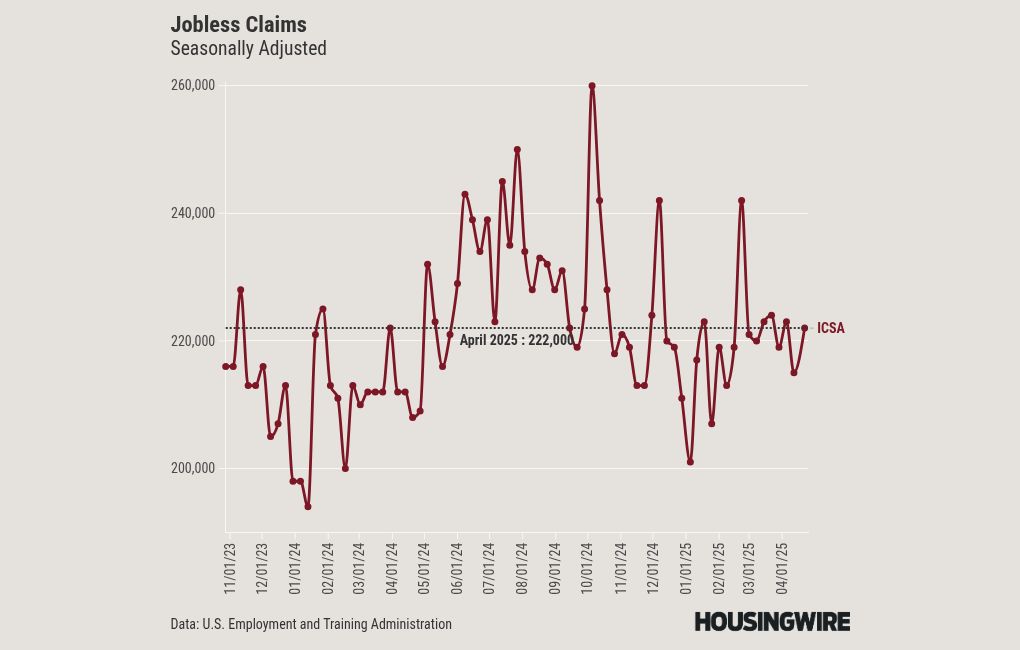
This week will feature a substantial amount of economic data, including reports on jobs, PCE inflation, home price, and pending home sales. I know how closely these numbers can affect our daily lives and decisions. It’s important to remember that at any moment, a headline could emerge that might shift the bond market, for better or for worse. Now, the jobless claims data has held up well the first four months of 2025 but certain economists and some Fed Presidents are expecting the hard data to get worse during the summer months. I am waiting to see what happens to the jobless claims data.
Despite the lag in economic data and some indicators showing people making purchases before the tariffs are imposed, observing how the bond market responds to each report and headline is crucial.
See all of the previous Housing Market Tracker articles here.
First Time Home Buyer FAQs - Via HousingWire.com