
Who would have predicted purchase application data increasing for 16 consecutive weeks on a year-over-year basis, with double-digit growth, during seasonal peak periods in 2025? And with elevated rates? Not me — I wouldn’t have taken this bet unless mortgage rates were trending between 6.64% and 6%, since that’s when we have seen better forward-looking data.
What is really going on here: Is demand getting better? The purchase application data can be a confusing data line so I am going to show some context for the 2025 data.
Purchase application data
Today’s purchase application survey from the Mortgage Bankers Association showed a 5% decline week over week, but there was a positive 13% year-over-year growth print. This marks three consecutive weeks of double-digit growth during this index’s seasonal peak period. This is how the year-to-date count looks now on the weekly data:
- 9 positive weeks
- 7 negative weeks
- 3 flat weeks
On that basis alone, 2025 would be a slightly positive year. What accounts for the 16 straight weeks of positive year-over-year data that we see in the chart today?
In the first half of 2024, mortgage rates rose toward the year-to-date high of 7.5%, resulting in a very negative week-to-week data run starting at the end of January and continuing through the start of June.
In 2024, we saw:
- 14 negative prints
- 2 flat prints
- 2 positive prints
- 0 year-over-year growth prints
Volumes weren’t crashing in 2024 — they were at very low levels, not growing. This situation created an extreme backdrop for comparison if we experience a year in which rates decline compared to the previous year. In simple terms, that’s what 2025 looks like.
Weekly and total pending home sales data
As part of our weekly Housing Market Tracker data, we monitor pending home sales. Last year, when mortgage rates decreased to around 6%, we saw a noticeable improvement in total pending home sales compared to previous years. This increase resulted in a few hundred thousand more home sales.
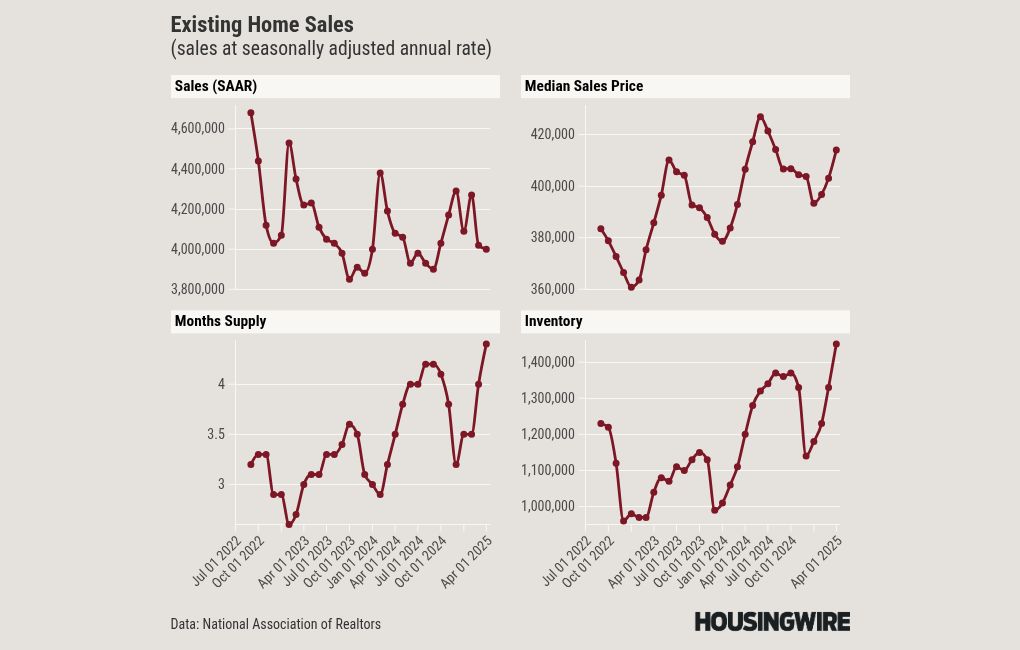
Also, this data line has recently shown some growth year over year, which wasn’t the case before. Starting in May and until October, we are going to see some low existing home sales comps, as most of those months will have sales data slightly under 4 million, where the first part of 2024 — February through April — had higher year-over-year comps.
If we break it down to the weekly pending home sales data, which can be volatile week to week, we are only seeing year-over-year growth as well.
To put it simply, we’re starting to observe some year-over-year growth in our weekly pending sales data, even amid elevated mortgage rates. While it’s not spectacular, it is growth. If mortgage rates fall, or if the double-digit growth in purchase applications can be sustained for the rest of the year, we should see slight improvements in the data.
I want to reiterate that housing data tends to improve when mortgage rates are around 6%. Additionally, homebuilders are still operating at sales levels comparable to those in 2019, as they’re creating a market with sub-6% mortgage rates by buying down rates.
Conclusion
It’s encouraging to see growth in purchase application data despite elevated rates, but in real terms, if we weren’t starting from an extremely low baseline in 2024, this growth would be less evident. However, the year-over-year increases in purchase application data, new listings and total active inventory — coupled with a slowdown in price growth — indicate that the housing market is operating from a healthier position compared to what we experienced in 2020, 2021 and early 2022, when inventory was too low and price growth was excessive.
Over time, the developments occurring in 2024 and 2025 will help make housing more affordable in the future, as supply is always the key factor.
First Time Home Buyer FAQs - Via HousingWire.com