
In 2025, despite a lot of negative economic headlines, mortgage purchase application data has shown positive year-over-year growth for 14 consecutive weeks. In today’s MBA purchase application survey, this data reflected an 11% increase week over week and a 13% increase year over year, indicating resilient market performance.
But how is this happening with terrible housing affordability and all these negative confidence sentiment index reports we’ve seen? Remember, even though doom and gloom gets all the headlines, life finds a way to move forward every year. Here are some reasons that explain the positive streak.
We’re working from a record low bar
Over the past two years, my theme has been: the bar for purchase apps is so low that we can trip over it. Also, millions of people buy homes each year —regardless of what is happening in the economy. Despite facing significant challenges in the 2008 housing crisis, the COVID-19 pandemic and now trade tensions, millions of people continue to enter the housing market.
With more than 162 million Americans employed and record-low sales levels, moving the needle doesn’t take much. As we observe in the data below, this trend is evident in the history of home sales: when mortgage rates rise, demand decreases. Over time, we establish a new low baseline, and eventually, sales tend to increase again.

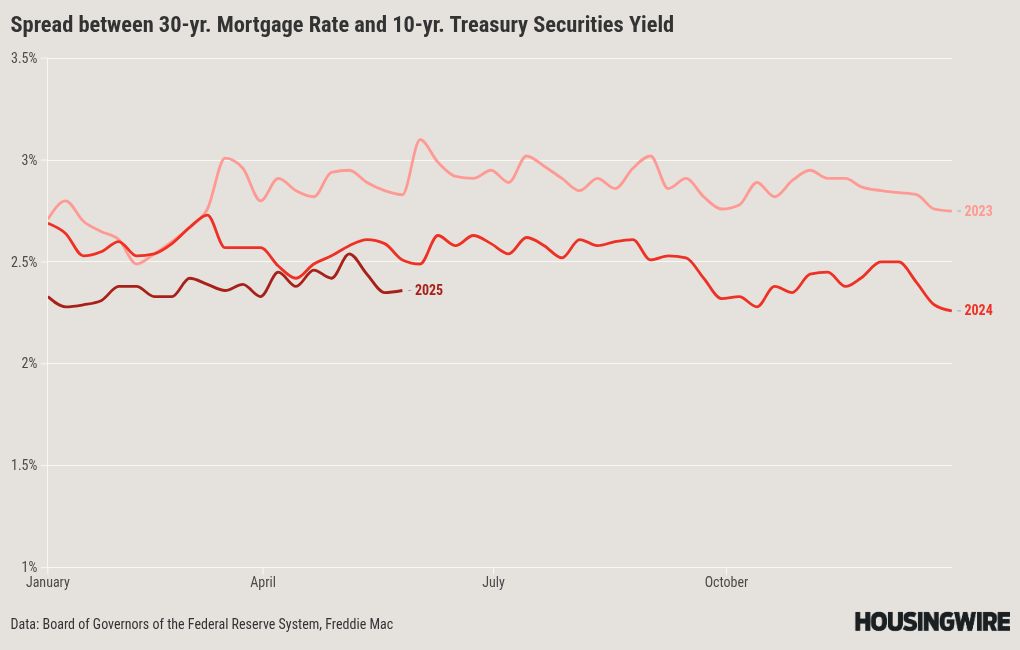
Mortgage rates fell this year vs rising last year
Last year, mortgage rates rose from 6.63% to 7.50% before declining towards 6%. This increase resulted in 18 consecutive weeks of negative trends in purchase applications. During this period, there were 14 weeks with negative week-to-week data, two weeks with positive data, two weeks with flat data, and no year-over-year growth.
This year, the 10-year yield peaked on Jan. 14 and has remained below that peak level since then. Consequently, mortgage rates fell instead of increasing at the start of the year. With these lower rates starting from a low base, we have experienced 14 consecutive weeks of positive year-over-year growth data.

According to the MBA purchase application data chart below, there is positive year-to-date data for 2025 and positive year-over-year growth recorded in 2025. These results are not too shabby, even with mortgage rates nearing 7%. Imagine what the year would have looked like if mortgage rates had just trended between 6% and 6.64%. In the past few years, that level is where we have seen the housing data improve.

Conclusion
What surprises me about the growth in purchase applications this year is that it’s happening at a mortgage rate level that has not produced year-over-year growth in this data line for years. Remember, every year we see wage growth, household formations, marriages leading to dual incomes and the creation of millions of jobs. If mortgage rates were closer to 6%, demand for housing would likely have been stronger and growth would be less surprising to me.
Remember that purchase application data is a trend survey, and today’s data being up 13% year over year doesn’t mean existing home sales will be up 13%. This data line looks out 30-90 days, and as long as it’s growing year over year, it’s a positive housing demand story.
Considering this data in context, we can continue to see slight sales growth this year. However, if mortgage rates were to drop to 6% or lower, the demand curve would have been better. Overall, the current situation isn’t bad, especially given the significant headwinds, negative headlines and generally discouraging sentiment we’ve encountered in 2025. With inventory growing and price growth cooling down, the 2025 housing story is a positive one for the future of housing.
First Time Home Buyer FAQs - Via HousingWire.com